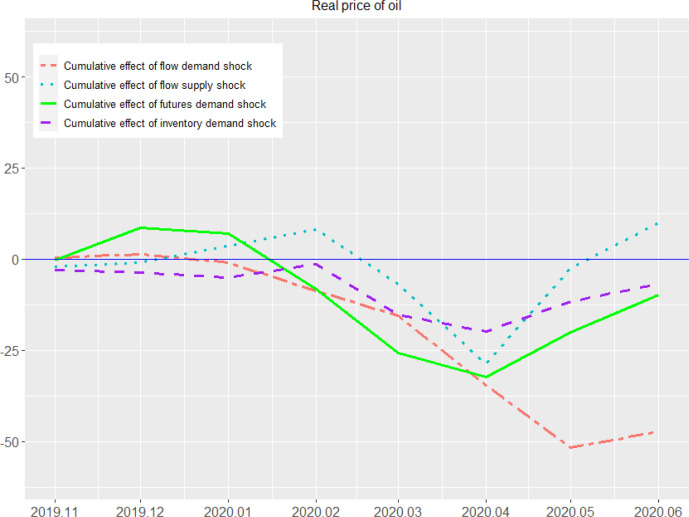
Commodity markets rarely move in a straight line. Prices respond to weather, production decisions, transportation constraints, consumer demand, inventories, currency movements, and expectations about what conditions may look like months from now. A strong rally can begin with something as simple as a supply disruption, while a seemingly healthy market can weaken when inventories build faster than expected. For anyone trying to understand these markets, the challenge is not simply identifying whether a commodity is becoming more expensive or cheaper. It is understanding why the market is moving and what the underlying data suggests about the next phase of the cycle.
That is where inventory data, futures curves, and supply-demand imbalances become particularly useful. These indicators provide different perspectives on the same market. Inventory levels show what is physically available, the futures curve reflects how traders are pricing different delivery periods, and supply-demand balances reveal whether a market is tightening or loosening. Learning how these signals interact provides a practical foundation for understanding commodity cycles without relying entirely on short-term price movements.
Why Commodity Cycles Matter
Commodity cycles develop because supply and demand do not adjust at the same speed. When demand rises suddenly, producers may need months or years to expand output, depending on the commodity. Existing inventories can absorb some of the pressure, but if stocks decline too quickly, prices may rise to encourage additional production or reduce consumption. Conversely, when production expands faster than demand, inventories can accumulate and eventually place downward pressure on prices.
This dynamic is central to
commodity market basics. Agricultural products may respond strongly to planting conditions and harvest expectations, while energy markets can be influenced by production capacity, refinery activity, weather, and transportation infrastructure. Metals can be affected by industrial activity, mine supply, investment demand, and changes in manufacturing. Although each commodity has its own characteristics, the underlying principle remains similar: prices help coordinate adjustments between available supply and changing demand.
Market participants therefore pay close attention to the physical fundamentals behind price movements. Organisations such as the U.S. Energy Information Administration, International Energy Agency, U.S. Department of Agriculture, and various commodity exchanges regularly publish information that can help investors and analysts assess inventories, production, consumption, and market conditions. These reports do not eliminate uncertainty, but they provide a more grounded framework for interpreting price action.
Reading Inventory Data
Inventory data is one of the clearest ways to assess whether a physical commodity market is becoming tighter or more abundant. When inventories decline consistently while demand remains stable or increases, the market may be signalling that available supply is struggling to keep pace. If inventories rise substantially, it can indicate that production is exceeding current consumption or that demand has weakened.
However, the absolute inventory number is rarely enough on its own. Seasonality matters enormously. Agricultural commodities, for example, naturally experience different inventory patterns around harvest periods. Energy inventories can also follow seasonal consumption trends. Comparing current stocks with historical averages, seasonal ranges, or inventories relative to expected demand can provide much more useful context than looking at one isolated figure.
The speed of change is also important. A gradual inventory decline may indicate normal seasonal consumption, while an unexpectedly rapid drawdown can suggest a developing supply constraint. Similarly, a sudden inventory build may deserve attention if analysts previously expected stocks to decline. Traders often focus on the difference between reported data and expectations because markets tend to react not only to what happened, but to whether the result was stronger or weaker than anticipated.
Understanding Futures Curves
A futures curve provides another window into commodity market conditions by showing how prices differ across delivery months. When nearby futures prices are higher than contracts farther into the future, the market is generally described as being in backwardation. When later contracts trade at higher prices than nearby contracts, the market is in contango.
These structures can contain useful information about supply conditions, storage economics, financing costs, and expectations. Backwardation may occur when immediate physical supply is relatively scarce, and buyers are willing to pay more for prompt delivery. Contango can develop when supply is plentiful enough that storing the commodity for future delivery becomes economically attractive, although the curve itself should never be treated as a standalone forecast.
The shape of the curve can also change as market conditions evolve. A commodity might move from contango toward backwardation as inventories tighten, or the reverse as production improves and supply becomes more comfortable. Watching these changes alongside inventory reports can reveal whether a price move is supported by changing physical conditions or is being driven primarily by expectations and financial positioning.
Conclusion
Understanding commodity cycles becomes much easier when price is treated as the starting point rather than the entire story. Inventory data helps reveal the physical availability of a commodity, futures curves provide insight into the economics and expectations surrounding different delivery periods, and supply-demand analysis explains the forces creating shortages or surpluses.
No individual indicator can reliably predict every commodity price movement. Markets are influenced by countless variables, and unexpected events can quickly change the fundamental picture. But by studying inventories, futures structures, and supply-demand balances together, market participants can develop a clearer framework for interpreting volatility.